Demos
There are currently two demos avalible for using the EpiMapper Python package, one for CUT&Tag data and one for ATAC-seq data. Arguments
CUT&Tag Human Histone Modification Demo
The data used in this demo is collected from GEO association: GSE145187 derived from Kaya-Okur et al. (2020).
This dataset consists of 6 samples, targeting two histone modifications: H3K4me3 and H3K27me3 with two replicates each, as well as two IgG control samples.
You need to download and create two folders:
fastq - containing demo FASTQ files from CUT&Tag, downloaded from : https://zenodo.org/records/10822274
in - containing all necessary input files for EpiMapper usage, downloaded from https://zenodo.org/records/10822349
Additionally, you need to create an “out” folder where the output will be stored. Folders can be created by using:
$ mkdir out
The script to run the demo is shown below:
# 1. fastqc

epimapper fastqc -f fastq -o out

# 2. bowtie2_alignment - To reference genome Hg38

epimapper bowtie2_alignment -f fastq -i in/bowtie2_index_hg38  -m True -o out

# bowtie2_alignment - To spike-in genome (E.coli)

epimapper bowtie2_alignment -f fastq -s True -i in/bowtie2_index_ecoli -m True -o out
Example table: After running bowtie2_alignment, the result (Table 1) appears as follows:
Sample |
Replication |
SequencingDepth |
MappedFragments |
AlignmentRate |
MappedFragments_SpikeIn |
AlignmentRate_SpikeIn |
|---|---|---|---|---|---|---|
d-H3K27me3 |
rep1 |
729951 |
729478 |
99.94% |
473 |
0.06% |
d-H3K27me3 |
rep2 |
695765 |
695534 |
99.97% |
231 |
0.03% |
d-H3K4me3 |
rep1 |
358119 |
357764 |
99.9% |
355 |
0.1% |
d-H3K4me3 |
rep2 |
472641 |
468294 |
99.08% |
4347 |
0.92% |
d-IgG |
rep1 |
134669 |
59177 |
43.94% |
75492 |
56.06% |
d-IgG |
rep2 |
603373 |
482561 |
79.98% |
120812 |
20.02% |
# 3. remove_duplicates
epimapper remove_duplicates -s out/Epimapper/alignment/sam -o out
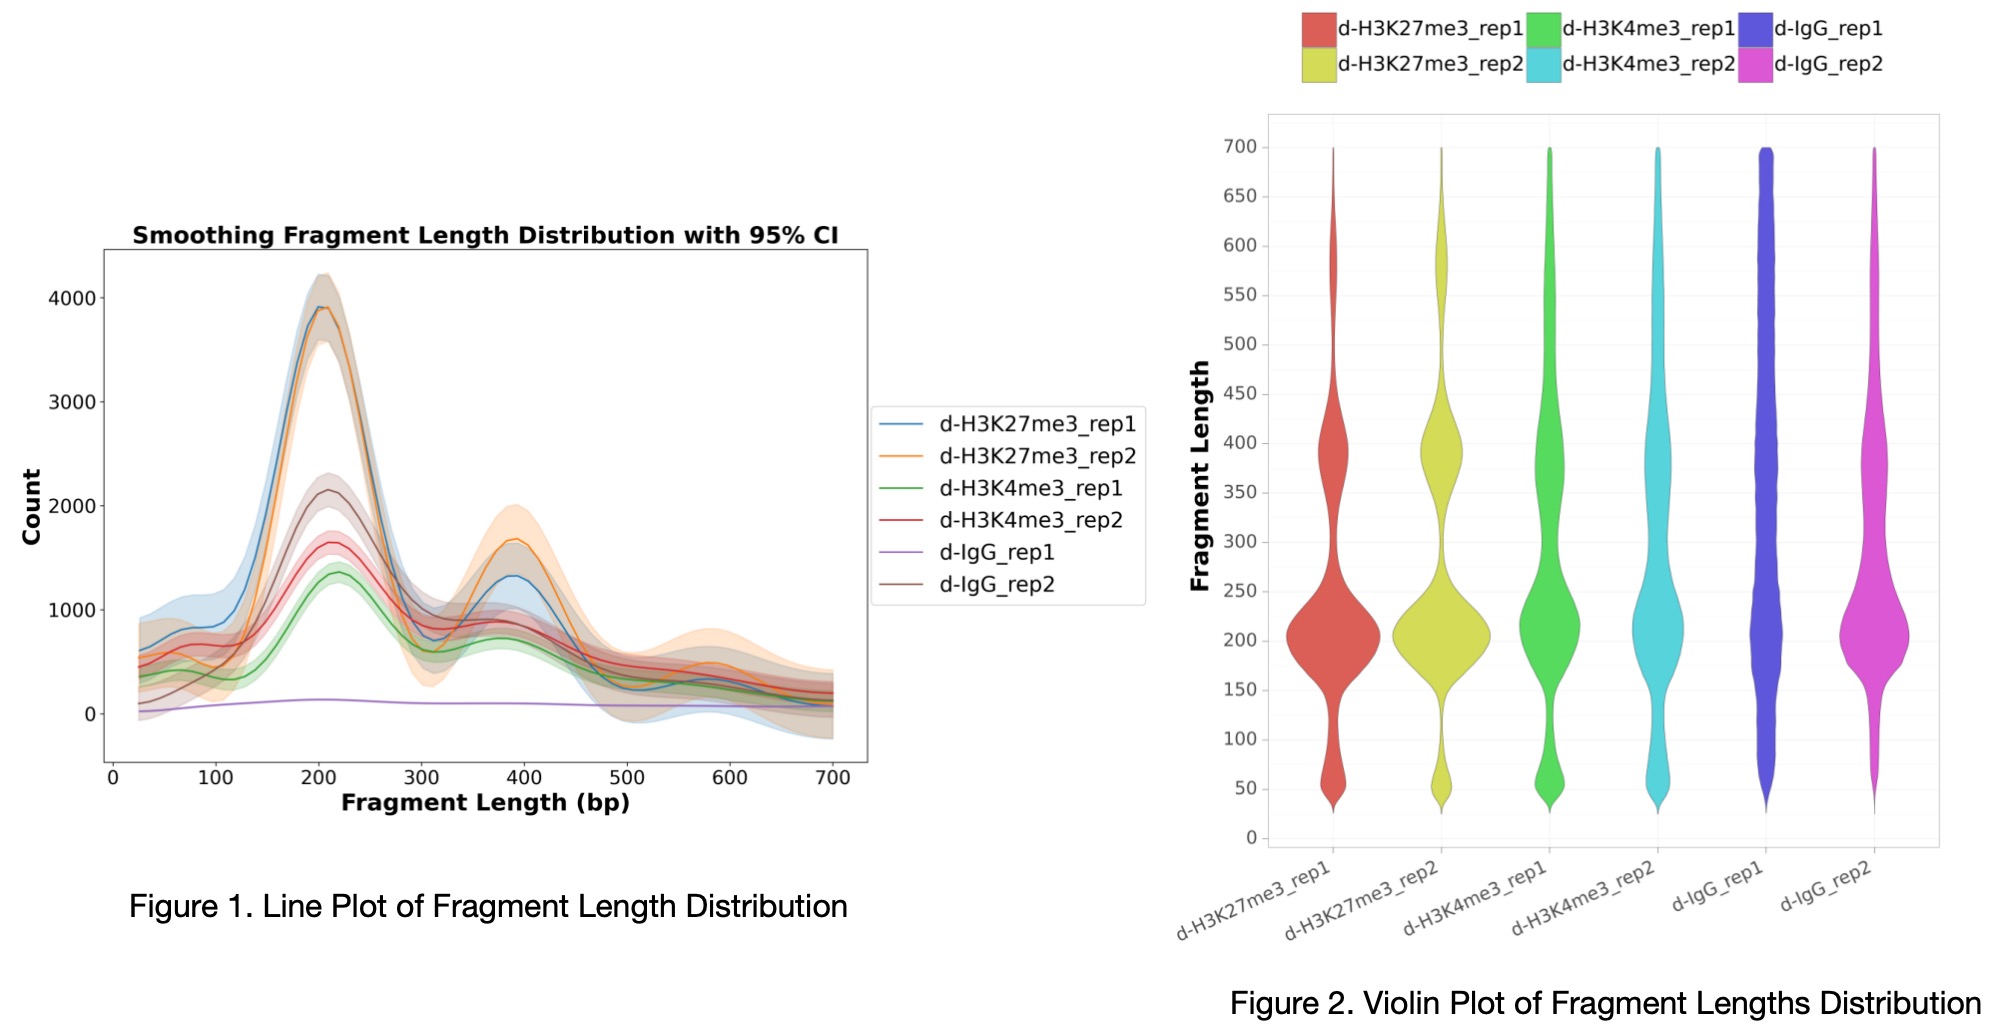
# 4. fragment_length
epimapper fragment_length -s out/Epimapper/alignment/removeDuplicate/sam_duplicates_removed -o out
Example Plot: After running fragment_length, the fragment length distribution plot (Figure 1 and Figure 2) appears as follows:
# 5. filtering
epimapper filtering -s out/Epimapper/alignment/removeDuplicate/sam_duplicates_removed \
-cs in/hg38.chrom.sizes.clear.sorted -bl in/blacklist.bed -sn True -o out
# 6. spike_in_calibration
epimapper spike_in_calibration -b out/Epimapper/alignment/bed -cs in/hg38.chrom.sizes.clear.sorted \
-ss out/Epimapper/alignment/sam_spike_in -o out
# 7. peak_calling
epimapper peak_calling -soft seacr -f out/Epimapper/alignment/bed -bg out/Epimapper/alignment/bedgraph \
-c IgG -o out
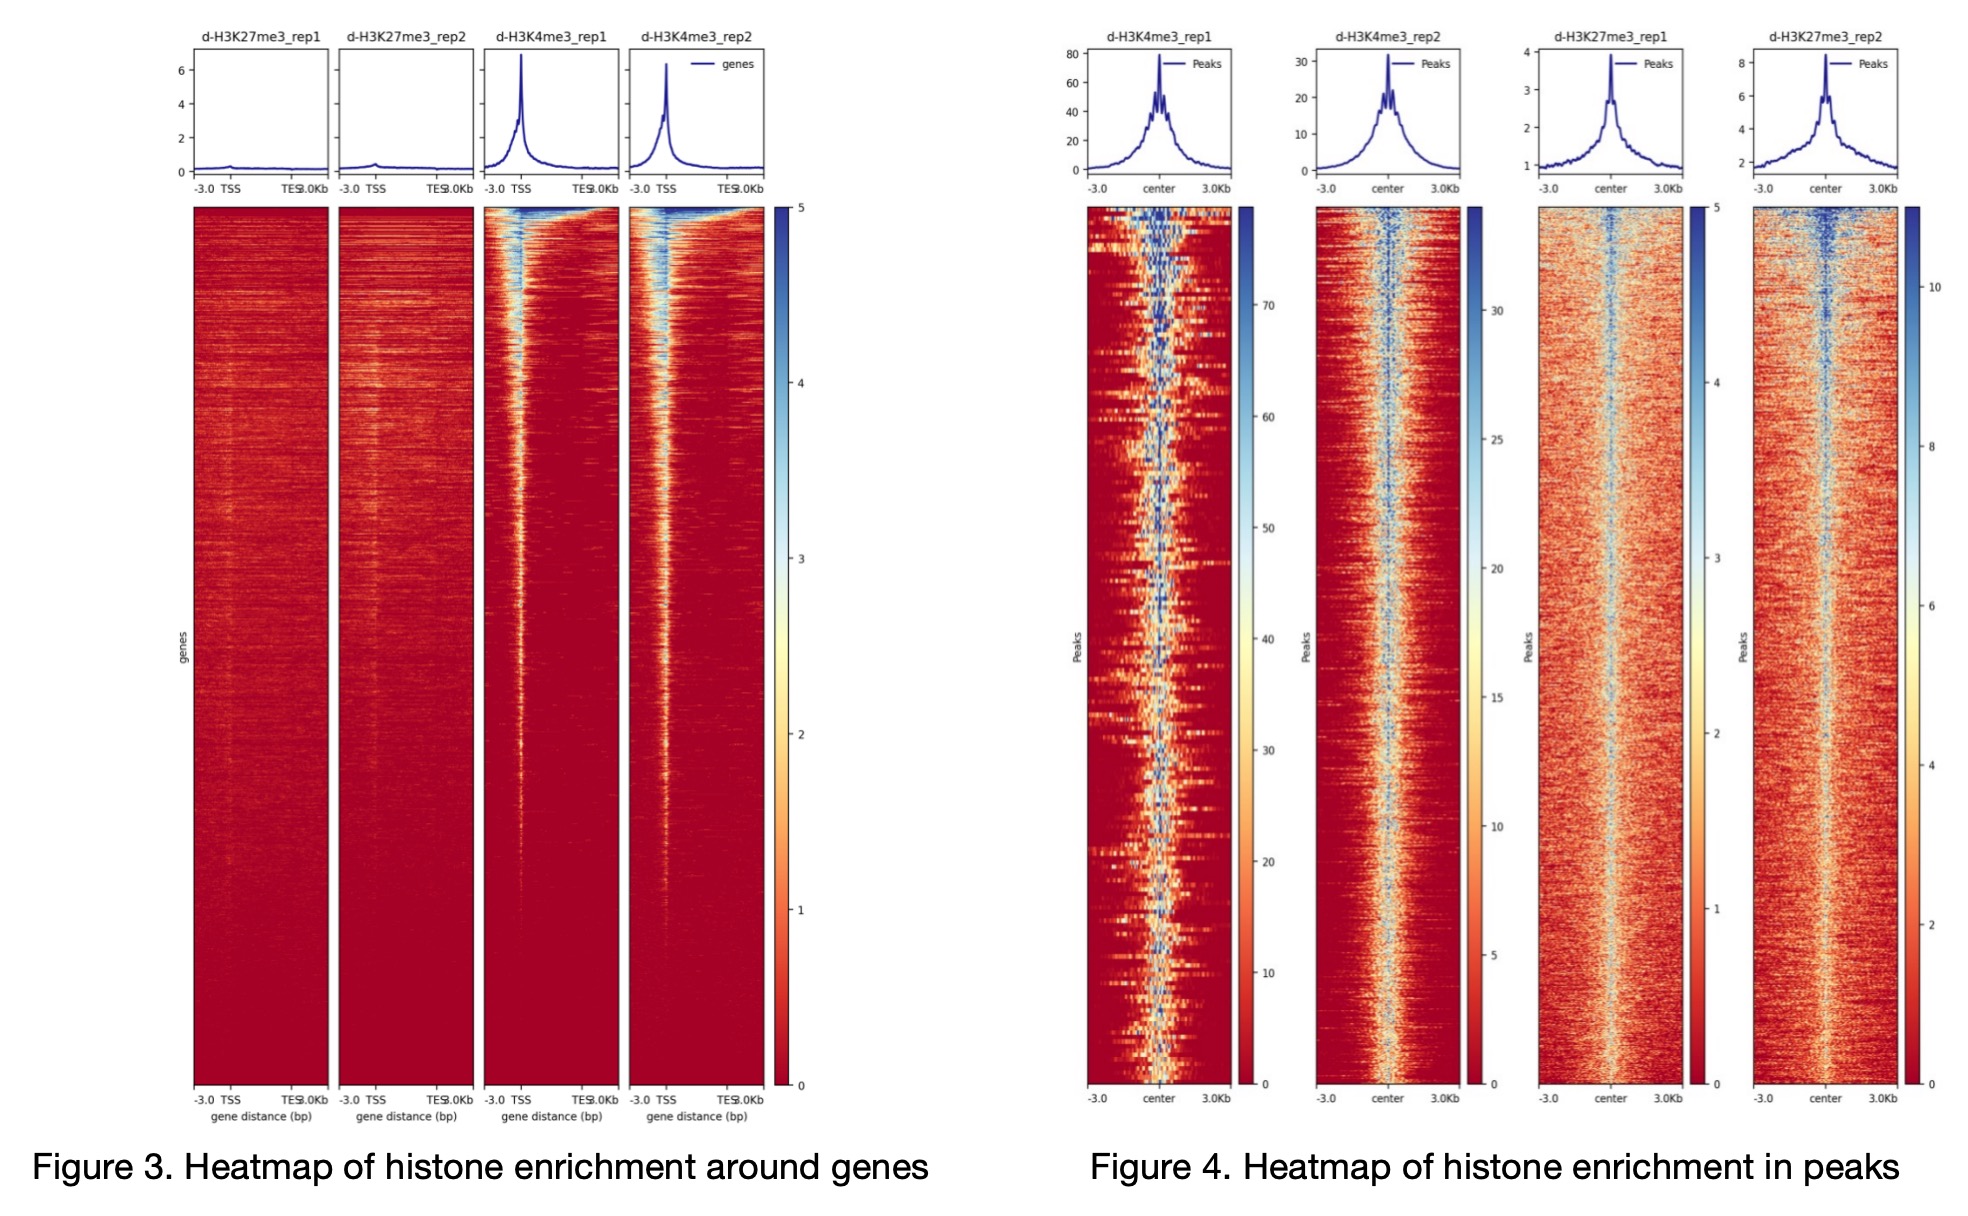
# 8. heatmap
epimapper heatmap -b out/Epimapper/alignment/bam -p out/Epimapper/peakCalling/seacr/control \
-bl in/blacklist.bed -r in/hg38.refFlat.txt -o out
Example Plot: After running heatmap, the heatmap of histone enrichment around genes (Figure 3 and Figure 4) appears as follows. Figure 4 is a composite heatmap constructed from individual peak heatmaps of single samples, represented as a single image in the original file.
# 9. differential_analysis

epimapper differential_analysis -p out/Epimapper/peakCalling/seacr/control \
-bg out/Epimapper/alignment/bedgraph \
-bl in/blacklist.bed -r in/hg38.refFlat.txt -cs in/hg38.chrom.sizes.clear.sorted \
-la H3K27me3_rep1 H3K27me3_rep2 -lb H3K4me3_rep1 H3K4me3_rep2 -an True \
-e  in/hg38_all_enhancers_merged_hglft_genome_327b3_4dmr.bed -o out
ATAC-seq Demo
The data used in this demo is from an ATAC-seq experiment of healthy/diabetic pancreatic islet, collected from Brysani et al (2020) with the GEO assositation: GSE129383.
Here, the demo data only contians the chr21 from the orginal data, to save space. This dataset conists of ATAC-seq data from 6 diabetic donors and 9 healthy donors, only one replicate from each sample. The data avalible for this demo is publicly avalible at a zenodo:
You need to download and create two folders:
fastq - containing demo FASTQ files from ATAC-seq, downloaded from : https://zenodo.org/records/10818453
in - containing all necessary input files for EpiMapper usage, downloaded from https://zenodo.org/records/10818469
Additionally, you need to create an “out” folder where the output will be stored. Folders can be created by using:
$ mkdir out
The script to run the demo is shown below:
# EpiMapper demo run on human ATAC-seq data (only chr21)

# 1. fastqc

epimapper fastqc -f fastq -o out

# 2. bowtie2_alignment

epimapper bowtie2_alignment -f fastq -i in/hg19_chr21_bowtie2_index -o out

# 3. remove_duplicates

epimapper remove_duplicates -s out/Epimapper/alignment/sam -o out

# 4. fragment_length

epimapper fragment_length -s out/Epimapper/alignment/removeDuplicate/sam_duplicates_removed -o out

# 5. filtering

epimapper filtering -s /Users/eier/Documents/demo/ATAC/out/Epimapper/alignment/removeDuplicate/sam_duplicates_removed \
-cs in/hg19_chromosome_sizes_sorted.txt -bl in/hg19-blacklist_sorted.bed -atac True -o /Users/eier/Documents/demo/ATAC/out

# 6. peak_calling

epimapper peak_calling -soft macs2 -f /Users/eier/Documents/demo/ATAC/out/Epimapper/alignment/bed -b /Users/eier/Documents/demo/ATAC/out/Epimapper/alignment/bam \
-gs 2.7e9  -o /Users/eier/Documents/demo/ATAC/out

# 7. heatmaps

epimapper heatmap -b out/Epimapper/alignment/bam -bl in/hg19-blacklist_sorted.bed \
-p out/Epimapper/peakCalling/macs2/top_peaks -r in/hg19.refFlat_chr21.txt -o /Users/eier/Documents/demo/ATAC/out


#8. differntial_analysis

epimapper differential_analysis -p out/Epimapper/peakCalling/macs2/top_peaks \
-r in/hg19.refFlat_chr21.txt  -bl in/hg19-blacklist_sorted.bed -cs in/hg19_chromosome_sizes_sorted_filtered.txt \
-fold True -an True -e in/hg19_all_enhancers_merged_4dmr.bed -o out \
-la diabetic-1_rep1 diabetic-2_rep1 diabetic-3_rep1 diabetic-4_rep1 diabetic-5_rep1 diabetic-6_rep1 \
-lb healthy-1_rep1 healthy-2_rep1 healthy-3_rep1 healthy-4_rep1 healthy-5_rep1 healthy-6_rep1 healthy-7_rep1 healthy-8_rep1 healthy-9_rep1